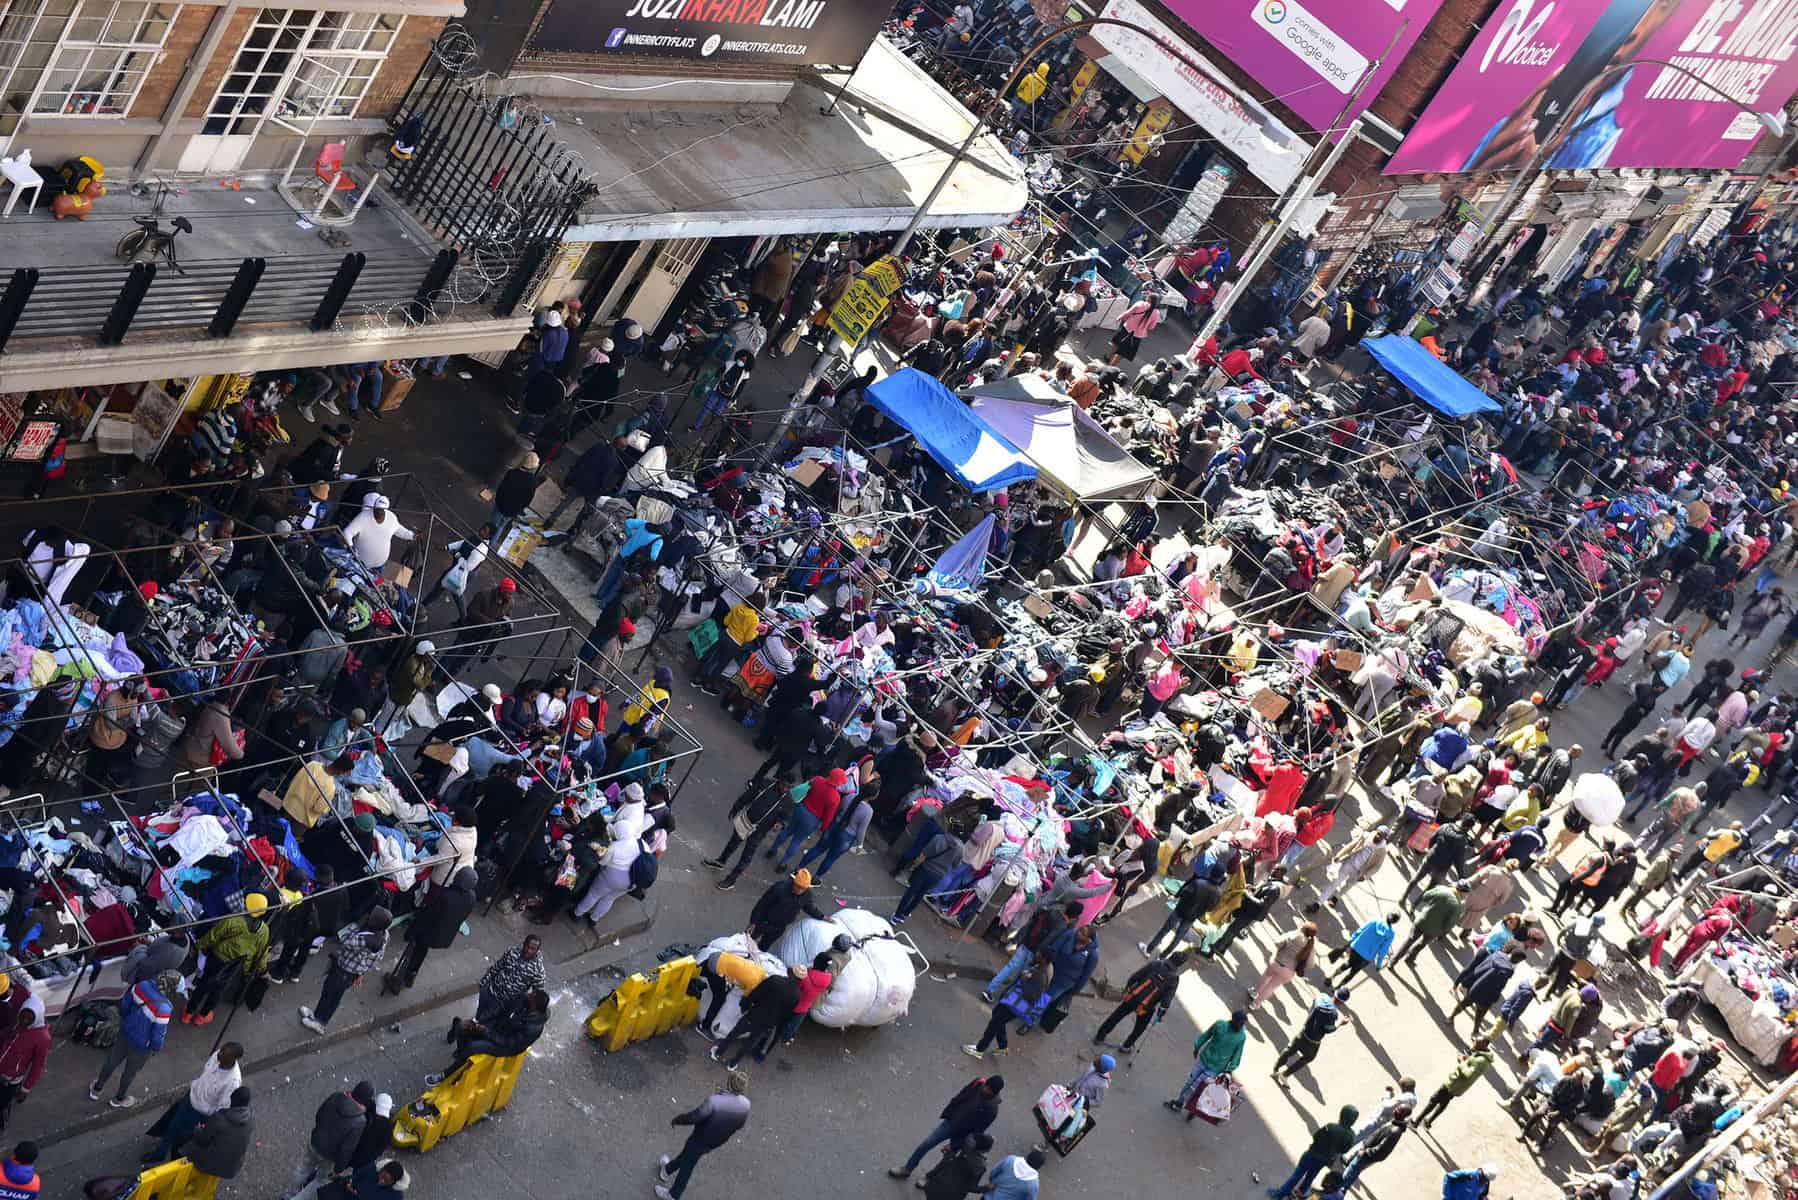
Informal traders account for more than half of business activity in eThekwini’s CBD, while Cape Town says it simply cannot count.
Here is what South Africa’s biggest cities revealed about who is really running their streets.
South Africa’s major metropolitan municipalities issued more than 32 000 street trading permits and informal trading contracts over the past five years, according to responses obtained by the Department of Cooperative Governance and Traditional Affairs (Cogta) following a parliamentary question tabled by Mokgaetji Mafagane of the MK Party in the National Assembly.
The question, directed at Cogta Minister Velenkosini Hlabisa, asked each of the country’s five largest metros – Tshwane, Johannesburg, Cape Town, Ekurhuleni and eThekwini – to account for how many street trading permits had been issued and what share of central business district activity was made up of informal versus formal trade.
What emerged was a fragmented picture of how South Africa governs its streets, with each city operating according to its own systems, its own definitions, and in Johannesburg’s case, offering no answer at all.
Who controls street trading, and why Pretoria doesn’t have the numbers
The department was quick to establish that this is not its data to hold.
According to Hlabisa, street trading permits, trading bay allocations and informal trading regulations fall squarely within the authority of individual municipalities, governed through the Municipal Systems Act and each city’s own bylaws.
As a result, no centralised national database of informal trading permits exists.
The department confirmed this in its reply, stating that the information “is maintained by the respective metropolitan municipalities in accordance with their bylaws.”
It further noted that the decentralisation of informal trading governance is consistent with how the function has been designed, spatially regulated through municipal bylaws and designated trading areas.
Despite having no obligation to compile this information, the department said it “requested this information from the relevant municipalities”.
Four of the five cities responded. However, the fifth – Johannesburg – did not, and the department acknowledged that “a follow-up request has been issued” and that Mafagane would be provided with the information once it was received.
Ekurhuleni leads permit count
Among the cities that did respond, the numbers varied dramatically. Ekurhuleni issued the highest number of permits by far, with 16 567 street trading permits and licences recorded over the past five years.
EThekwini followed with 11 700 permits issued over the same period.
Tshwane issued 2,506 street trading permits, while Cape Town recorded 1 372 informal trading contracts.
However, the city was careful to explain that this figure does not capture the full extent of trading activity within its boundaries.
Cape Town operates what it described as a dual system, one that combines designated trading bays, which require permits, with what it calls “free trade areas,” where traders may operate without any permit at all, provided they comply with applicable bylaws.
Because of this, the city said that activity in free trade zones “cannot be accurately quantified due to the absence of a centralised permit requirement.”
In effect, a significant portion of Cape Town’s informal trading economy exists entirely outside the permit system, not illegally, but simply untracked.
EThekwini’s streets are majority informal, Tshwane’s are not
When it came to the composition of CBD trading activity, the cities that could answer painted starkly different pictures of their economic landscapes.
The gap between formal and informal trading
In eThekwini, informal street trading dominates.
The municipality reported that permitted informal street trading accounts for 55.2% of CBD trading activity, with formal licensed businesses making up the remaining 44.8%.
This makes eThekwini the only metro among those that responded where informal traders outpace formal businesses in the city centre.
Tshwane’s CBD tells a different story. The city reported that formal licensed businesses account for 67.2% of CBD activity, while permitted informal street trading makes up 32.8%.
Ekurhuleni sits somewhere between the two, with formal businesses accounting for 78.9% of CBD activity and informal street trading making up 21.1%, the smallest informal share among responding cities.
Cape Town, again, said it was unable to provide a percentage split. Although it confirmed that there are 271 designated trading bays in its CBD, the city noted that it “does not maintain a consolidated register of all licensed formal businesses except where specific business licences – such as those for entertainment and food outlets – are required.”
Without that consolidated register, any percentage would be, at best, an estimate.
No common yardstick, no national baseline
Perhaps the most significant finding to emerge from the department’s response is not any individual city’s figures, but the revelation that there is no standard way to measure any of this.
The department acknowledged that “there is no uniform national methodology for measuring the proportion of informal trading versus formal business activity in CBDs.”
Each municipality relies on its own internal systems of permit records, trading bay allocations, spatial designations and business licences to arrive at its numbers.
This is precisely why some cities were able to produce figures while others could not.
The department noted that this methodological inconsistency “explains why some metros can provide numerical percentages, while others, such as Cape Town, cannot.”
The implication is that even where figures have been provided, they are not directly comparable; each city is, in effect, measuring something slightly different.
The department concluded by reiterating that it “does not maintain a national repository of street trading permits or CBD trading composition, as these functions fall within municipal competence.”
It confirmed it had obtained whatever data was available from four of the five specified municipalities. Johannesburg’s figures remain outstanding.
READ NEXT: These stores have been flagged for mistreating consumers