Cape Town’s combined dam levels have fallen to 60.1% as of 2 February 2026.
The latest figures represent a drop from the previous week’s reading of 62.2%, according to data released by the City of Cape Town and the Department of Water and Sanitation.
The decline represents a loss of nearly 19 000 megalitres of stored water in just seven days, with the total volume dropping from 559 008 megalitres to 540 243 megalitres.
The current storage level is significantly lower than the same period last year, when dams were at 80.3%.
The system provides water not only to Cape Town but also to towns in the Overberg, Boland, West Coast, and Swartland areas, while supplying irrigation water for agriculture through its network of dams, pump stations, pipelines, and tunnels.
According to reports, the city is licensed to abstract approximately 60% of the available supply, while agriculture accounts for 33% of the allocation, with the remainder distributed to smaller towns across the region.
Major dams show varied decline
Among the six major dams in the Western Cape Water Supply System, Steenbras Upper experienced the sharpest weekly decline, dropping from 78.9% to 69.2%.
Berg River dam fell from 63.8% to 60.7%, while Theewaterskloof, the region’s largest reservoir, decreased from 57.2% to 55.6%.
Voëlvlei and Wemmershoek dams showed relatively smaller decreases, moving from 70.3% to 68.8% and from 70.2% to 69.4% respectively.
Steenbras Lower declined from 58.7% to 55.6% during the same period.
Year-on-year comparison
Compared to 2025 levels, all major dams are showing substantial deficits.
Berg River is down from 81.6%, Steenbras Lower from 72.4%, and Steenbras Upper from 96.1%.
Voëlvlei and Wemmershoek dams decreased from 80.1% and 74.2%, respectively.
Theewaterskloof also suffered a major blow to its water levels, dropping from 80.2%.
“Because each dam size is different, the best indicator of overall dam water levels is the total quantity stored expressed as a percentage of total dam capacity,” the city noted.
ALSO READ: Cape Town warns residents as dam levels plummet
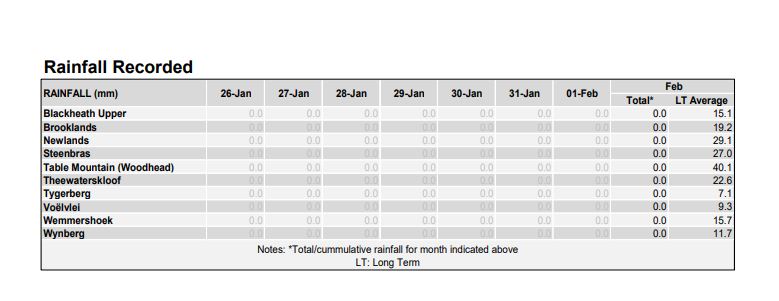
No rainfall recorded across catchment areas
Rainfall data for the week ending 1 February reveals zero precipitation across all monitored locations, continuing a dry spell that has persisted since late January.
No rainfall was recorded at any of the major catchment areas, including:
- Blackheath Upper,
- Brooklands,
- Newlands,
- Steenbras,
- Table Mountain (Woodhead),
- Theewaterskloof,
- Villiersdorp,
- Voëlvlei,
- Wemmershoek, or
- Wynberg.
“The dams in and around Cape Town form part of the Western Cape Water Supply System, which is an integrated and collectively managed system of dams, pump stations, pipelines, and tunnels,” according to the City of Cape Town.
The lack of rainfall has contributed to the steady decline in water levels. Cumulative totals for February so far stand at zero across all measurement stations.
There may be good news on the horizon, though, with long-term averages for the region in February typically seeing moderate rainfall.
Minor dams at 48.8% capacity
The region’s minor dams, which include eight facilities with a combined capacity of 4,377 megalitres, are currently at 48.8% overall storage. This represents a weekly decline of 0.99 percentage points from the previous week’s 49.8%.
Individual minor dam levels vary considerably. Klipheuwel at Simon’s Town sits at 37% capacity, while Land-en-Zeezicht in Helderberg stands at 83.7%. Alexandra and De Villiers, both located at Table Mountain, are at 32.5% and 57% respectively.
Hely-Hutchinson at Table Mountain recorded 13.9% capacity, while Lewis Gay in Simon’s Town reached 65.5%. Victoria and Woodhead, both at Table Mountain, measured 43% and 82.2%, respectively.
READ NEXT: Lesotho Highlands project: More water coming to Gauteng, but it doesn’t mean taps won’t run dry